Photometers & Turbidimeters
Inline Turbidity Measurement for Brewing: Automation, Efficiency, and QA at Scale
Manual turbidity sampling gives large breweries an accurate picture of process conditions at one moment in time. At high production volumes in multiple fermenters, with multiple brands, and with continuous filtration, one moment may not […]

The Case for Turbidity in Dairy Phase Monitoring
Key takeaway: Replacing conductivity with optical turbidity measurement allows dairies to detect phase transitions precisely, recover more product, and reduce wastewater load during CIP operations. The approach provides consistent, measurable control across production cycles, improving […]

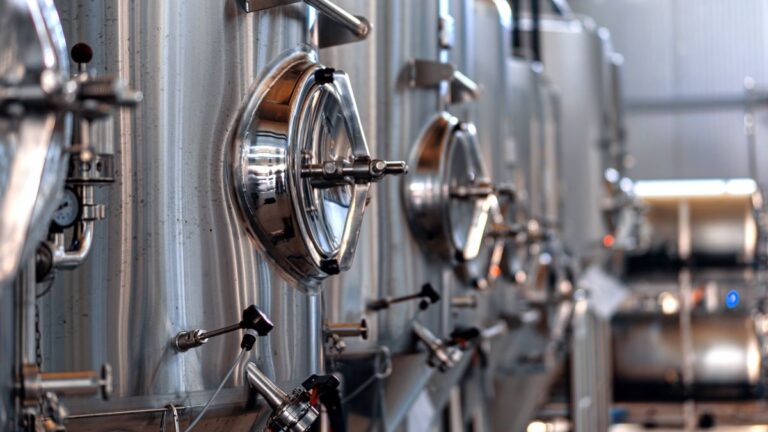
Hygienic Turbidity Measurement Solutions for Contamination-Free Brewing
Modern breweries face a technical challenge that extends beyond simple process monitoring. While turbidity measurement provides valuable data for optimizing production efficiency and product quality, implementing hygienic turbidity measurement in brewing environments requires meeting stringent […]
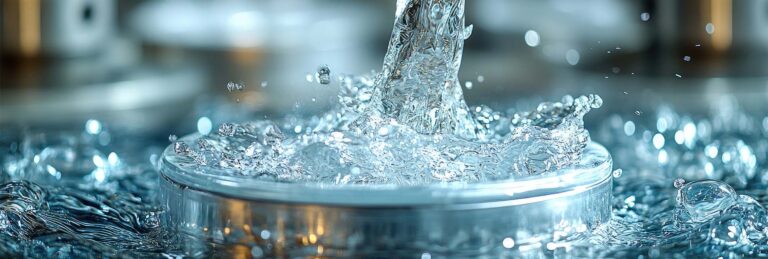
Precision at 0.01 NTU: Advanced Turbidity Measurement for Premium Water Applications
Turbidity—the measure of relative clarity of a liquid—serves as a critical quality indicator across numerous industries. While municipal water systems typically monitor turbidity primarily for safety and regulatory compliance, manufacturers of bottled water and ultra-pure […]

Single-Use Measurement Cells: The New Standard in Bioprocessing
The shift toward single-use technology in bioprocessing represents one of the most significant changes in pharmaceutical manufacturing methods. While disposable components have become commonplace in many aspects of production, measurement instrumentation has traditionally relied on […]
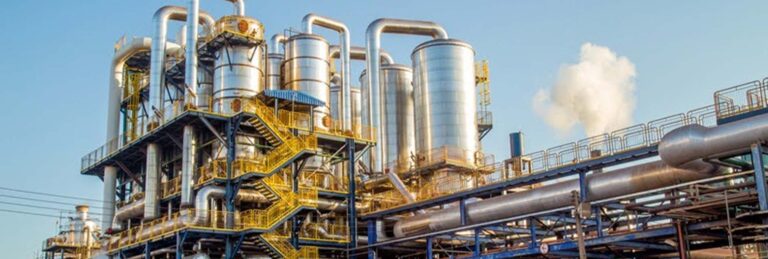
From Fine Chemicals to Biotech: Advancing Trace Water Measurement in Industrial Solvents
Solvent purity directly affects product quality, process efficiency, and regulatory compliance in fine chemicals, pharmaceuticals, and biotechnology. Impurities in solvents can compromise chemical reactions, alter product properties, and damage equipment. Among these impurities, water is […]
SOUTH FORK INSTRUMENTS
3845 Buffalo Road
Auburn, CA 95602
Tel: (+1) 925-461-5059