Having the right analyzer can make a big difference to separation performance
Reliable and repeatable post column UV measurements are a minimum requirement for column chromatographic separation processes to ensure good protein fraction purity and maximum yields. With the lack of any cost-effective, industrialized inline spectrophotometer scanning systems for UV measurement, industry has tended to go for discrete wavelength analyzers/photometers to perform this vital task. The question is which analyzer is best equipped to provide real-time single or dual wavelength UV analysis for instant visibility and improved control of the separation process?
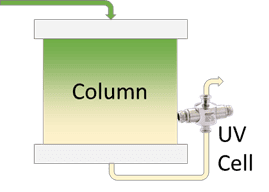
Column chromatography is widely used in bioprocessing to separate protein molecules from concentrated process fluids. The center of such a chromatography system is a column, filled with a media specific to the separation being carried out. There are a variety of methods employed in chromatographic separation — gel filtration, ion exchange, hydrophobic interaction, affinity to name a few — but all have the same need to accurately and distinctly identify UV absorbance peaks post-column.
The Role of the UV Absorbance Analyzer
Separation through chromatography requires highly specialized equipment to ensure maximum yield and purity, and a typical system will include a variety of instruments and sensors. A UV absorbance analyzer at the column outlet detects protein coming off the column (because nearly all proteins absorb UV energy at or around 280nm). The analyzer measurement cell is fitted in the outlet line of the column, and as proteins exit the column, the absorbance output “peaks” up, allowing protein-rich solution to be diverted for collection.
Zero Hold-Up Volume for Complete Clarity
One important factor often overlooked is that a UV analyzer should have zero hold-up volume to ensure crisp, sharp peaks are detected. UV analyzers utilizing measurement cells with internal hold-up volumes can lower the purity of the collected protein because of dilution. Dilution blurs sharp peak detection lines, making collection trigger points far more difficult to define.
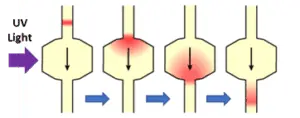
Dilution effect on a protein “slug” passing through in an optical cell with hold-up volume
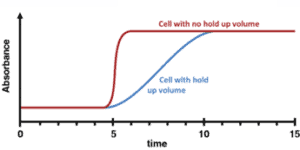
Effect on UV absorbance peak sharpness
Measuring Deep Absorbance
Advances and improvements in bioprocessing methods have led to protein products being expressed and concentrated to higher and higher levels. Higher protein concentrations mean higher inline absorbance measurements. Therefore, UV analyzers need the ability to measure deep absorbance.
While absorbance measurement following Beer-Lambert Law is essentially linear (up to a certain point, anyway!) as long as the UV-light source being used is monochromatic, some inline UV analyzers use light sources that generate light at wavelengths other than 280nm; this is particularly true of analyzers/photometers that use mercury vapor arc lamps. Light energy from these additional wavelengths enters the measurement path as stray light to create artificially low absorbance readings and generates a non-linear result (compared to offline sample analysis) as concentration increases. At higher concentrations, the analyzer response becomes increasingly non-linear, eventually flat, as the stray light becomes the dominant part of the measurement.
Plus and minus
As a result, optical filters are used to block stray-light energy in many instruments, but this has both positives and negatives. On the plus side, analyzer linearity is improved because the light energy passing through the filters focuses the absorbance measurement more upon the wavelength of interest.
On the minus side, band pass filters also block a significant part of the light energy at the wavelength of interest, so light sources need to be more powerful. The design of many inline photometers has the UV light source installed directly on the measurement cell. High levels of UV energy (from all wavelengths including 254nm) and the associated heat generated by the lamp are introduced to the flowing stream when the analyzer is operating, making them less than ideal, particularly for fragile protein molecule work.
Performance, Traceability and Validation
Baseline drift, due to the decay of the mercury vapor lamp is a common feature of inline UV absorbance analyzers. In addition, mercury light sources are inherently “noisy” as the internal arc generated by high voltage naturally flickers and moves. These two features mean that baseline adjustment or zeroing is continually needed and data recorded from the analyzer will often exhibit spikes along trend lines on charts.
Because of these factors, it is necessary to constantly “calibrate” and adjust these units. The best way is always to use a liquid standard, but some liquid standards (Potassium Dichromate, for instance) may not be chemically compatible with the process and process samples of varying absorbance may not be available. A suitable substitute is to use traceable optical filters certified by a third-party laboratory. Laboratory benchtop spectrophotometers are calibrated/validated using such filters and the same ones should be used for the online analyzer to provide direct linkage between online and offline sample testing results. Custom fit filter devices for validation purposes are problematic as this linkage cannot be properly established.
So Which Analyzer Comes Out on Top?
Everyone agrees that accurate, reliable, and repeatable post column UV measurements are a minimum requirement for chromatographic separation to ensure good protein fraction purity and maximum yields. To achieve these goals, the desirable features of an inline UV analyzer seem to be:
- Zero holdup volume
- Deep absorbance measurement capability
- No zero/baseline drift
- Has a linear measurement performance according to Beer-Lambert Law
- Low energy light source
- Low heat light source
- Ability to validate to the same standard as a laboratory/benchtop spectrophotometer
A closer look at Kemtrak DCP007
Taking the above into account, the unit that immediately stands out in the crowd is the Kemtrak DCP007 analyzer. This particular unit utilizes:
- Zero holdup volume inline measurement cells that ensure crisp peak detection without dilution effects.
- Solid-state light sources (LED’s) to remove the problem of stray light blockage and allow for measurement depth up to 4.5A at 280nm (@1cm optical path). With a short pathlength, it’s possible to reliably measure up to 90 OD without “peak clipping”.
- A unique optical bench design that monitors both emitted and received light when in operation. Emitted UV light energy is maintained at a continuous level with the result that zero/baseline drift is eliminated.
- True absorbance (A) as its baseline measurement. Measurement linearity follows Beer-Lambert Law until the process concentration itself introduces non-linearity from molecule density.
- LED light sources that emit “cold” light. Because emitted light is monochromatic, heavy optical filtering is not necessary. Accordingly, light loss from optical components is very low and therefore, emitted energy is low. Because of its low heat and extremely compact nature, the light bench is installed in the analyzer electronics enclosure and connected to a very compact measurement cell using fiber optic cables. Additional benefit of the low energy light output is an exceptionally long light source lifetime.
- The ability to be validated to the same standard as a laboratory/benchtop spectrophotometer. Using cuvette style traceable filters, the baseline measurement behavior of the analyzer can be tested and observed, providing absolute confidence in measurement.